- Trabajo con capas en 3D
- Introducción
- Añadir capas
- Añadir capas raster
- Añadiendo capas vectoriales
- Propiedades de las capas vectoriales 3D
- Creación de la caché de visualización
- Capas de objetos 3D
- Edición de capas de objetos 3D
- Tabla de contenidos
- El menú de contexto de las capas
- Edición de propiedades
- Cacheado de la leyenda
- Simbologia 3D
- Extrusión
- Etiquetado
- Transparencia
- Propiedades específicas
- Refrescar capa
- Zoom a la capa
- Copiar, cortar y pegar capas
- Trabajando con Tablas
- Herramienta de información
- Herramienta de selección en vista
Trabajo con capas en 3D
Introducción
The layers of information in the 3D views are exactly the same as in the normal views, thus the way to work with them is the same.
In the 3D extension a new layer type has been added. They are called 3D objects. These layers contain objects tridimensional modelled. Their functioning will be explained later on.
Añadir capas
The same tool “Add Layer” used in the normal views to add layers is used in the 3D views, using the same data source types. The window to select the layers to be added is exactly the same:
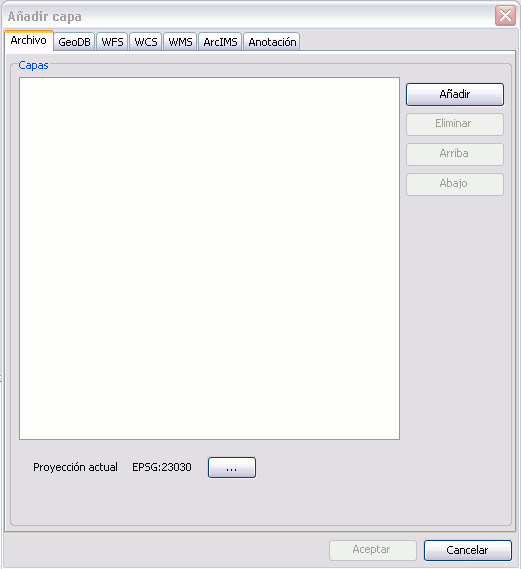
Adding layer window
Añadir capas raster
The data sources providing information of raster type are raster files and the WMS, WCS and ArcIMS Map services. The 3D views allow representing the raster data in two ways: as images (flat over the terrain surface) and as elevation (defining the terrain relief).
The 3D extension offers to the user the option to represent a raster as elevation in the following cases:
- For raster files, when they only have one band (normal situation with digital terrain models - DTM’s).
- For WMS services, when the TIFF or geoTIFF formats are selected. In the case the raster is to be used as elevation, it would be necessary to choose a style allowing for those values, usually indicated as "integer", "unsigned int", or 16 (or more) bits per pixel.
- For WCS services, when the GEOTIFF_INT16 is selected and there are no parameters (bands) selected.
In the case that is possible to use the raster as elevation the following dialog will appear:
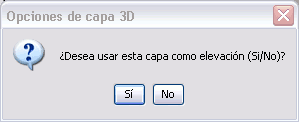
Loading option dialog of layer as elevation layer.
Only one elevation layer will accepted in each 3D view. If the user tries to add additional layers to the view the following message will appear:
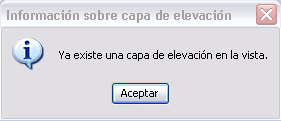
Control of additional elevation layers dialog.
At the moment gvSIG is able to reproject rasters, therefore there should not be any problem using layers with different reference systems to the view.
Añadiendo capas vectoriales
The data sources that can provide information of vector type are the vector files (SHP, DWG...), the vector databases and the WFS y ArcIMS Feature services.
The 3D views allow representing vector data in two ways: rasterised, as images glued over the terrain surface, and as three dimensional objects. The 3D extension offers the user the two options for all the mentioned data sources, although the results obtained with the ArcIMS Feature Service is not adequate for representation as 3D objects given how it draws this type of layer.
When the user adds a vector layer to the view the following dialog will show:
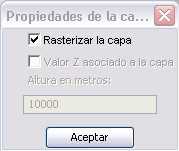
Vector layer options.
When the rasterisation option is deactivated to represent the vector data as objects in 3D, the elevation values (Z component) given by the geometry of the data can be used. If this option is selected and the geometry does not contain Z values, it will default to zero. This can complicate the visualisation in 3D since the terrain surface will mask the data.
Because of that, if the vector data does not contain elevation it would be better if the user assigns an elevation value in meters using the entry field in the lower part of the dialog.
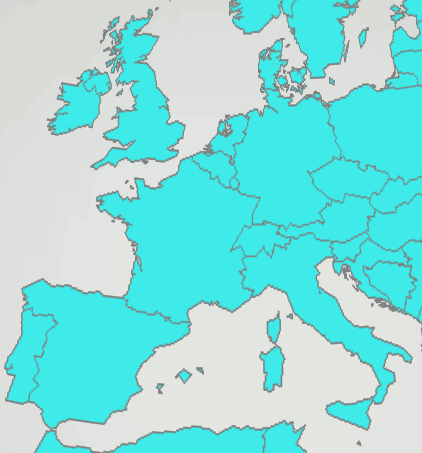
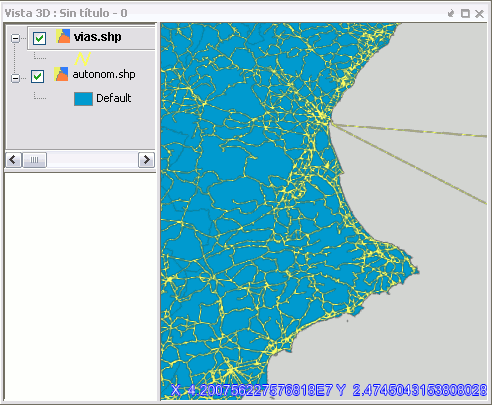
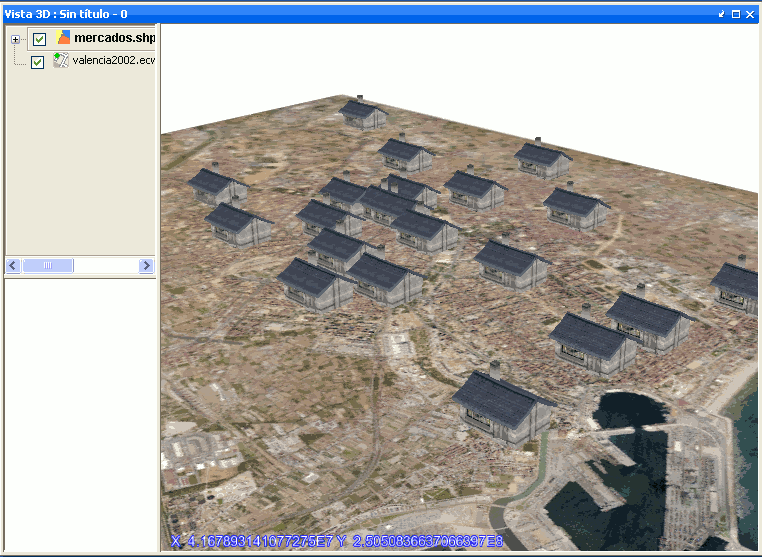
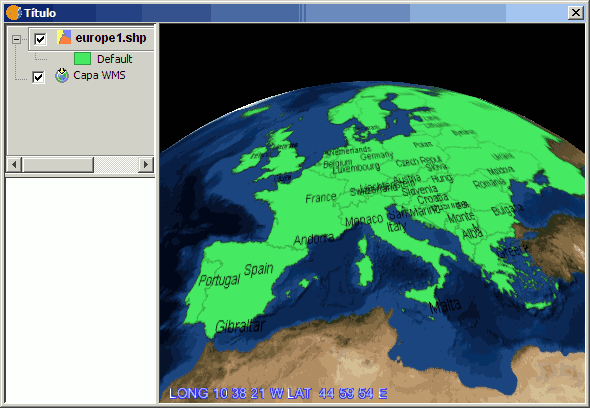
Example: Capture of layer with rasterised polygons in Europe.
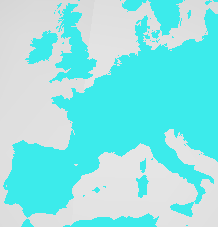
Example: Capture of layer with un-rasterised polygons in Europe.
Propiedades de las capas vectoriales 3D
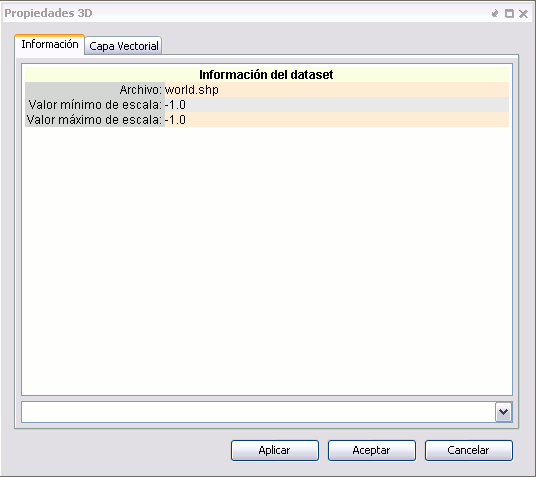
As it was shown in the previous section, it is necessary to indicate in which way the vector layers will be represented in the 3D view. It is possible to change the type of representation by using the 3D properties of a layer.
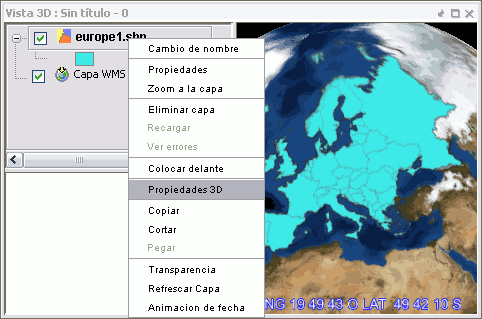
If we go to the TOC and right-click over the vector layer, a context menu will appear. We will select “Propiedades 3D” and the following dialog will show up:
If we go to "Opciones" in the “Capa vectorial” tab, we could modify the way to represent the 3D layer.
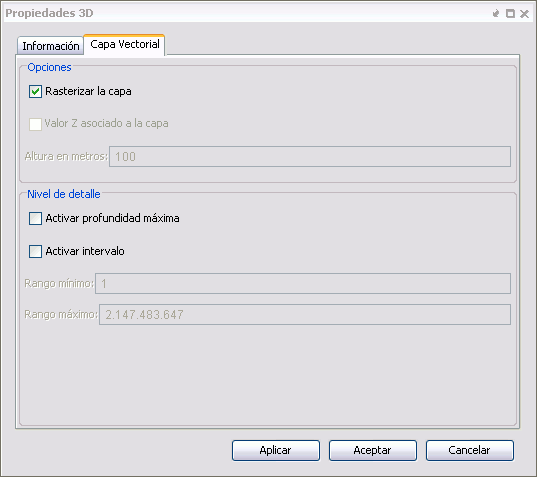
In the same windows we could see there is another section “Nivel de detalle” and there are several other related options:
- Activar profundidad máxima: This option calculates the maximum depth to which the layer is valid and does not continue subdividing.
- Activar intervalo: This option indicates over which subdivision interval the layer is visible.
Creación de la caché de visualización
Once having added layers, either as images or elevation layers it should be noted that data takes some time to become visible at their maximum resolution. This happens because the 3D extension creates a multi-resolution representation of the layer in the local hard drive which is used for quick visualisation of the data at different scales. This visualisation cache is actually stored in the local folder gvSIG\.data\cache\Earth within the user’s root directory.
The first time data is visualised or when the scale or the view is changed, the cache generation process is executed automatically. The speed of the cache creation will depend on the speed to access the source (it will be much slower for remote services) and the complexity of the data (e.g., vector quantity). Once the cache is created, panning within the same area will render fast and interactive visualisation. However, if the properties of the layer are changed and they affect the existing cache, this will be recreated automatically.
There is a way to force a cache to be invalid (See the “Refresh Layer” section).
Capas de objetos 3D
Upload layers of 3D objects
The layers of 3D objects are loaded in the same way that layers are loaded for a vector or raster file.
In the dialog of add layer from file, click on the add button and under "Select file type" select GvSIG OSG Driver
The formats of 3D object layers that GvSIG can load are files of type .osg and .Ive.
To learn how to generate those formats refer to the section Create layers of 3D objects and Save layers of 3D objects.
Create layers of 3D objects
The tool to create 3D object layer  can be found on the toolbar when a 3D view is active.
When you click on the create 3D layer button, a new layer of vector type is created immediately and a message appears indicating that the layer has been automatically set to editing mode.
Save layers of 3D objects
The tool to save layers with 3D objects  can be found in the toolbar when you select a 3D objects layer in a 3D view and is also it activates the editing mode of that layer.
If we click on it you will get the following dialog box, where we can select the path and file format (*.osg or *.ive) in which we want to save the layer.
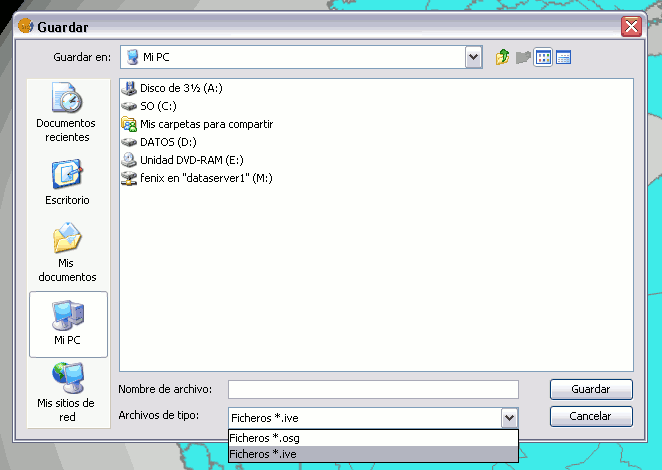
Note: The file format *.osg is an ASCII type while the file format *.ive is a binary type.
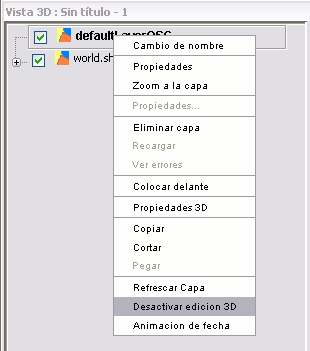
Edición de capas de objetos 3D
Enabling/disabling editing of 3D object layers
To enable/disable editing of 3D object layers simply click on the selected layer and right-click on it. In the context menu select Enable 3D editing, if you want to activate the 3D edition or Off 3D editing, if you want to disable the 3D edition.
Insert 3D objects
The tool to insert 3D objects  can be found in the toolbar when you select a 3D objects layer from a 3D view and also the active layer is in editing mode.
If you click on it you will see the following dialog box:
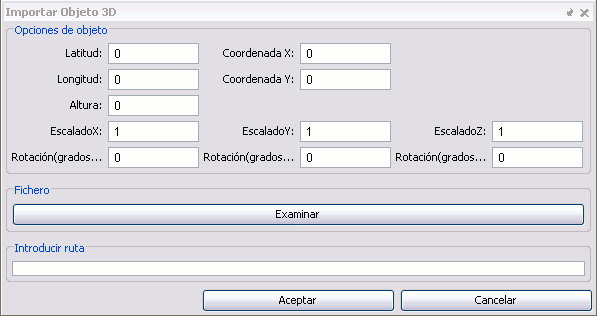
Where each item means:
- Object options
- Latitude, longitude and height: Position of the 3D object is defined by its latitude, longitude and height. Contingent to the projection (spherical or planar) of the object view, they need to be set to meters or degrees.
- X and Y coordinates: These are the X and Y coordinates of the screen.
- Scale X, Y and Z: Scale that we want to give the object initially. You can change it posteriorly, look at manipulation of 3D objects
- Rotation X, Y and Z: rotation that we want to give the object initially. You can change it posteriorly, look at manipulation of 3D objects
File: If you click on the browse button, you can choose the 3D object you want to load.
Enter path: You can enter the path to the file containing the 3D object.
Insertion using the mouse: Once you open a dialog to insert 3D objects, if you click on the 3D view the fields of latitude, longitude and height are automatically filled in order to visually place the 3D objects.
- Note:* The file formats supported are *.ive, *.osg, *.3ds, * obj. (Future versions will include more).
Manipulating 3D Objects
To manipulate 3D objects is necessary to enable the editing of 3D layers and have selected the layer to be manipulated.
- Selecting a 3D object: Clicking the left mouse button on the item you want to select.
- Unselecting a 3D object: Clicking the left mouse button outside the 3D object.
- Ungroup 3D object: With the object selected click on the icon from the toolbar or press the letter G.
- Group 3D object: With the object selected click on the icon from the toolbar or press the letter U.
Types of manipulators:
- Tab Box Dragger: Manipulator where a wrapping box appears around the object, and through which the 3D object can move in any direction. You can also use it to scale the 3D object

Icon on the toolbar.
- Track Ball Dragger: Manipulator where there is a sphere enclosing the object, and by which you can rotate the 3D object in any of its axes.

Icon on the toolbar.
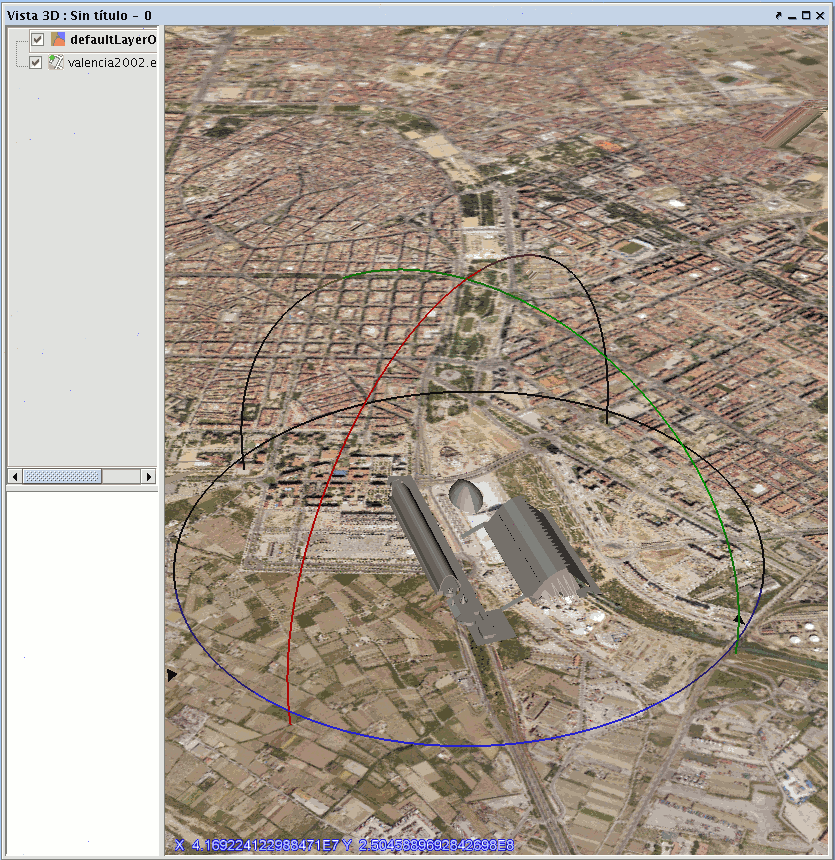
Tabla de contenidos
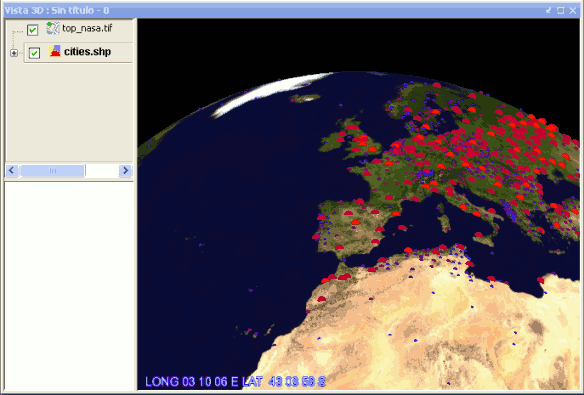
The Table of Contents (TOC for short) included in the 3D view behaves exactly like the TOC of the 2D view, showing the layers added to the view and legend.
As in the 2D view, you can use the TOC to easily change layer visibility. In the case of the elevation layer, if this is made not visible the elevation will disappear from view, leaving surface with no relief.
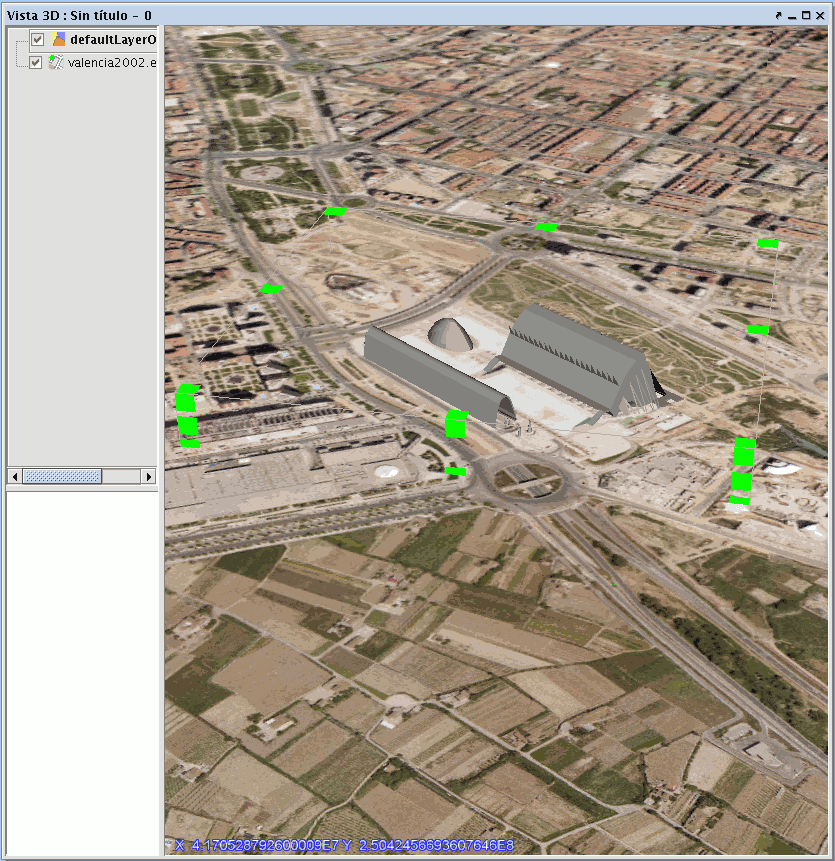
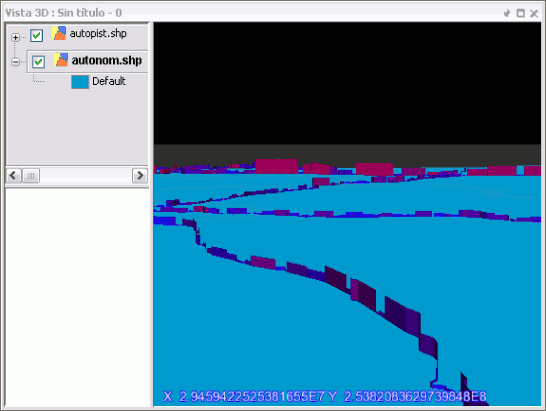
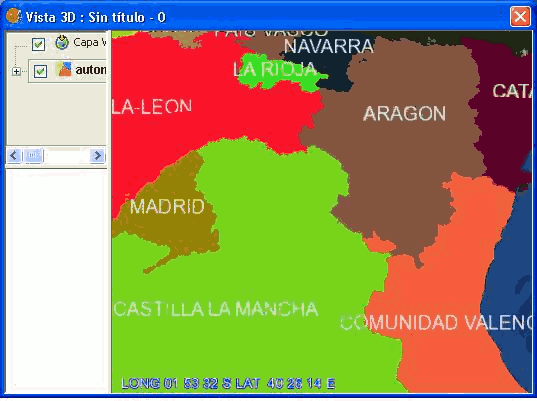
Another feature of the TOC is to control the display order of the layers (which are visible over the others). That is achieved by dragging the layers up or down. In the 3D view this order applies only to the vector or raster image layers, but does not affect the layers of 3D objects or elevation layer. The following example shows how the order affects two vector raster layers but has no effect on the elevation layer.
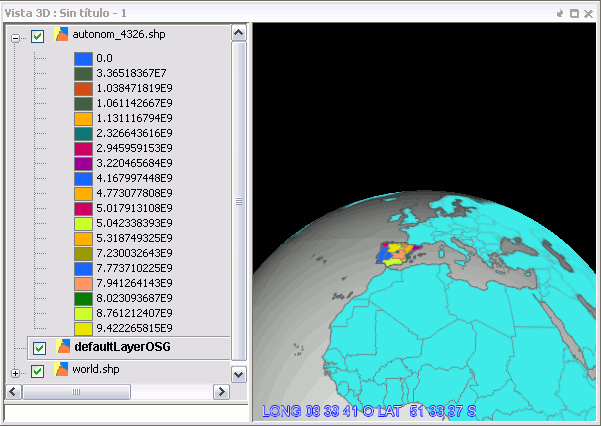
TOC and corresponding 3D view
El menú de contexto de las capas
In the 3D view TOC layers have a context menu practically the same as the normal view, with some additional tools. We will discuss the most relevant options.
Edición de propiedades
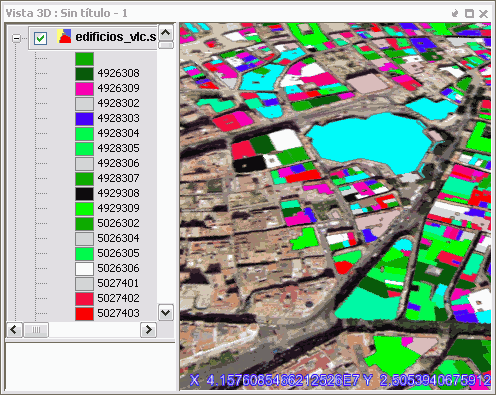
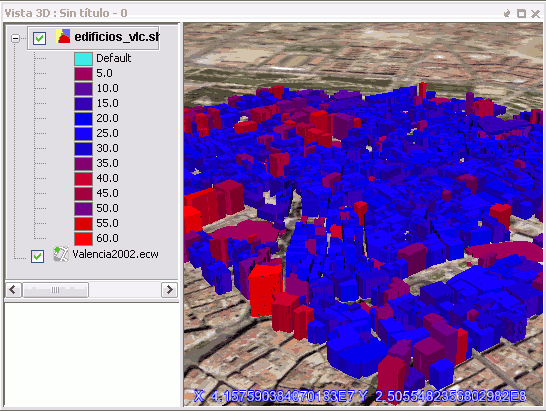
Using the context menu you can change the name of the layer, color (in the case of a vector layer with single symbol) and edit its properties window. In the case of changing certain properties, like the legend, the display cache is re-calculated layer, usually automatically. The figure shows the appearance of a polygon layer used in previous examples, after changing his legend to unique values.
The properties of symbols are applied to layers represented as images in the same way as would apply in a 2D view (eg the thickness and style of the lines).
Moreover, in the case of vector data represented as 3D objects, the application of the symbology is limited to the size of dots and lines, and color of symbols.
Note: A new type of legend called extrusion and a new kind of symbol for 3D points have been created. Look in the Extrusion and 3D Symbology sections.
Cacheado de la leyenda
In the cache for rasterized vector layers, the legend is also saved in .xml. When the same vector data source is added back as a layer, this legend is assigned by default, allowing for the reuse of the cached images. If the legend changes (see above), the cache is rebuilt and the new .xml file is saved.
Simbologia 3D
Using the power of the new symbology framework. The 3D plugin has added the possibility of inserting a new symbology for points. Specifically, we can generate a 3D Object type symbol and insert it as a symbol in a 3D layer-type vector point.
To do this open the "Symbol Properties Editor (see the manual gvSIG version 1.9-Alpha or later). In the panel for "Properties" we will deploy the list and select where it says Object 3D symbol and a panel will appear as shown below:
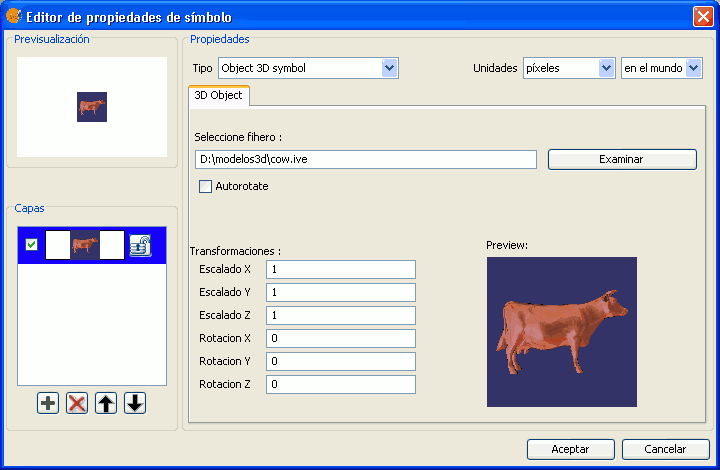
And where the boxes mean:
- Select files: You must indicate the file containing the 3D geometry.
- Autorotate: If selected, the model is always facing the camera.
- Transformations:
- Scale X, Y and Z: Scale to be applied to the model.
- Rotate X, Y and Z: Indicates the rotation to be applied to the model.
- Preview: Shows a preview of the 3D object. By default a sample model will show.
Then add the new model and delete the one given by default and it would show as follows:
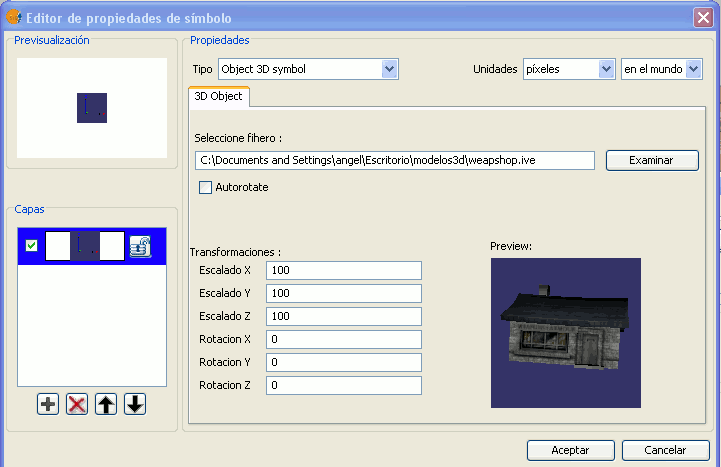
And the result would be.
Extrusión
Extrusion is a new kind of legend that has been created in the 3D plugin. This legend is used to extrude any primitive type (points, lines and polygons) that contains a vector layer in function of a given multiplication value.
A more technical definition of extrusion is:
Generating an object of dimension n+1 by the extension of a object dimension along a defined range in an additional dimension.
To use this new type of legend we have chosen to display as 3D vectors the layer that has been inserted in the 3D view.
Open the legend window and select where it says Extrusion. This window looks much like the legend of unique values. The following screen appears.
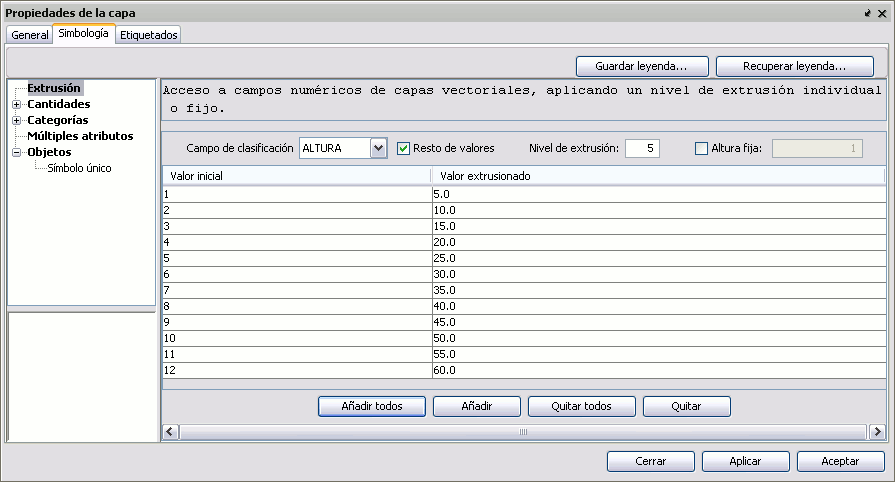
Choose the field on which you want to extrude and the extrusion level you want to apply. Click on the button to add all and accept.
Extruding polygons.
Extruding lines.
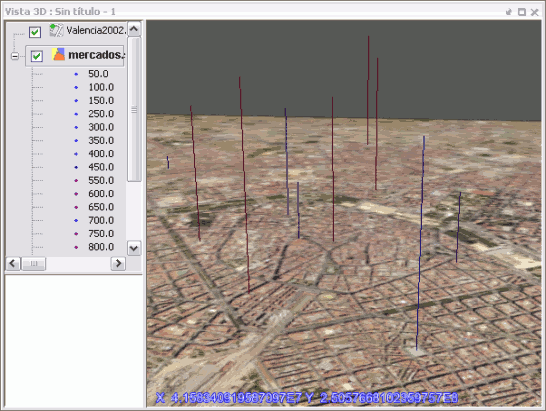
Extruding points.
Etiquetado
Labeling should be consistent whether the vector layer is rasterized or not. When the layer is rasterized, the labels are too. Its size and color is given by the tagging options, like in the 2D view.
On the other hand, when the vector layer is not rasterized, the labels will appear as floating text with the corresponding 3D objects for the data. Their size and color is again given by the tagging options.
Note: Only basic labeling is available in the 3D plugin.
Transparencia
In the context menu of the layers there is an option to change the transparency of an image layer (or rasterised vectors) interactively. This option can be activated from the toolbar and also from the Layer menu.

Icon on the toolbar.
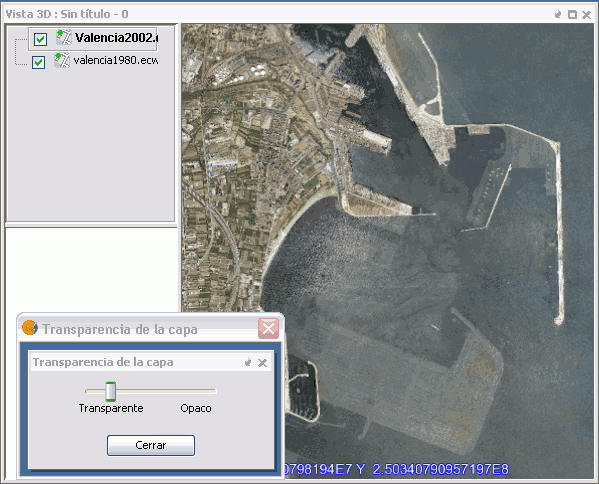
Example of extension of transparency and results.
When the tool is activated, a dialog appears with a scroll bar that lets you change the layer transparency interactively. It must be said that the interactive transparency tool has its impact over the transparency display of raster layers.
Propiedades específicas
Raster type layers and layers of remote services have specific properties that are active in the context menu. In the 3D view these menu options can be used to open the same windows of properties displayed in the layers of normal view.
Refrescar capa
From the context menu of the layer the display cache can be manually refreshed. This may be necessary for:
- Reflect changes that have occurred in the code (for example, if it has been edited)
- Regenerate a cache that somehow got corrupted
- In rasterized vector layers that are loaded from a project file, to generate the visualization cache with the legend stored in the project rather than with the legend cached (which may have changed since the project was saved)
- Force a visual refresh of the layer that does not happen automatically.
Zoom a la capa
This command works the same as in the normal view. The 3D view will change to show the full extent of the layer. In the spherical view, for very extensive layers it will display the full planetary globe.
Copiar, cortar y pegar capas
With the context menu sections of a 3D view can be cut or copy and paste into another normal view or 3D view. Conversely, sections can also be cut or copy from a normal view to be pasted in the 3D view.
When a layer is pasted from a 2D to 3D, the user will be able to choose the same options (elevation or image, rasterization of vectors) that if the layer were added directly from the data source.
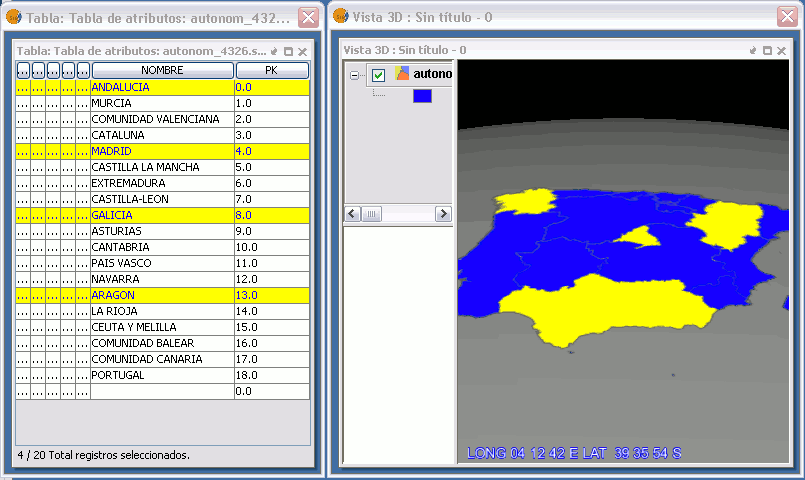
Trabajando con Tablas
As in the 2D views, the tool 'View Table of Attributes' is available for vector layers on the toolbar and in the Layer menu. When using this tool it will show the attribute table of the active layer and will be possible to perform all the tasks, as sort fields, etc..
Records can be selected in the table manually, apply filters, etc.. The tool 'Zoom to Selected' can be used as in 2D to quickly find the records selected in the view. Also the tool 'Delete Selection' works as in normal view.
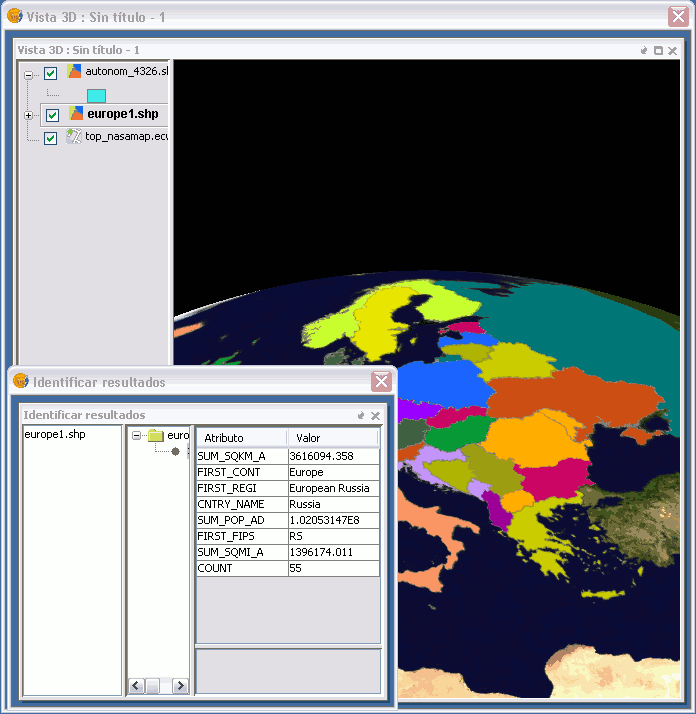
Herramienta de información
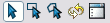
Like many of the tools available to the 2D, the information tool has been adapted to be used in the 3D plugin and it works just like in the version for 2D views. To access from the toolbar press the button:

Information button.
or from the bar menu "View / Search / Information.
To obtain information about each of the elements of the map the "Information Tool" is used.
When you click on any element with this tool, gvSIG shows, in a dialog box, the attributes of that element. For that to function the layer in which the feature you want to identify has to be activated in the TOC
Herramienta de selección en vista
The selection tool in view has been adapted to be used in the 3D view. It works for raster layers as well as for those that are not.
Selection options.
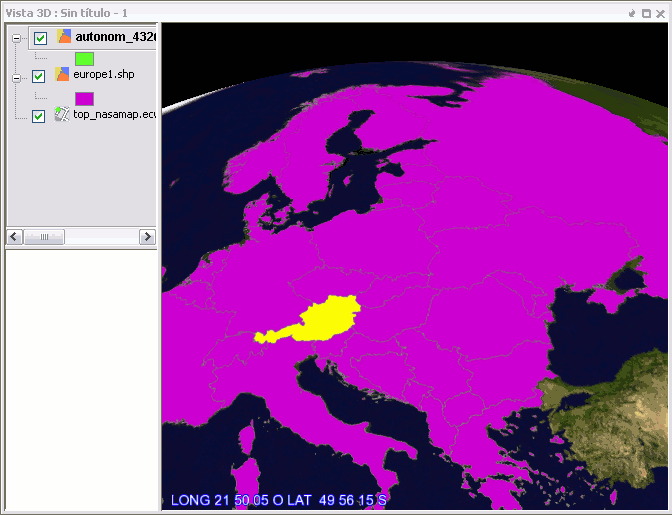
Selected area in yellow.
